

What others say
Description
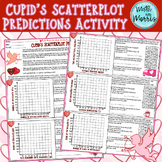
Help Cupid get ready for Valentine’s Day with this engaging scatterplot activity! Students will practice essential data skills by plotting points, drawing trendlines, and analyzing real-world data to make predictions. Each scenario is creatively tied to Valentine’s Day, such as Cupid’s aim, candy inventory, hot chocolate sales, and delivery times, making math both fun and festive. Perfect for 8th-grade math, this activity reinforces concepts like correlation, trend analysis, and prediction in a memorable way.
What’s Included:
- Student Handout (2 pages): Includes five Valentine-themed scatterplot scenarios with tables, graphs, and prediction questions.
- Answer Key (2 pages): Fully worked-out solutions for easy grading.
Skills Covered:
- Plotting points on scatterplots
- Drawing and interpreting trendlines
- Identifying types of correlation (positive, negative, or none)
- Using trendlines to make predictions
TEKS Alignment:
- 8.5(D): Use a trend line that approximates the linear relationship between bivariate sets of data to make predictions
- 8.11(A): Construct a scatterplot and describe the observed data to address questions of association such as linear, nonlinear, and no association between bivariate data
Why You’ll Love It:
This resource combines Valentine’s Day fun with critical thinking and real-world math applications. It’s a hit with students who enjoy the thematic connection and teachers who appreciate the seamless integration of math standards. Great for individual practice, stations, or enrichment activities!
Highlights
What others say
Description
Help Cupid get ready for Valentine’s Day with this engaging scatterplot activity! Students will practice essential data skills by plotting points, drawing trendlines, and analyzing real-world data to make predictions. Each scenario is creatively tied to Valentine’s Day, such as Cupid’s aim, candy inventory, hot chocolate sales, and delivery times, making math both fun and festive. Perfect for 8th-grade math, this activity reinforces concepts like correlation, trend analysis, and prediction in a memorable way.
What’s Included:
- Student Handout (2 pages): Includes five Valentine-themed scatterplot scenarios with tables, graphs, and prediction questions.
- Answer Key (2 pages): Fully worked-out solutions for easy grading.
Skills Covered:
- Plotting points on scatterplots
- Drawing and interpreting trendlines
- Identifying types of correlation (positive, negative, or none)
- Using trendlines to make predictions
TEKS Alignment:
- 8.5(D): Use a trend line that approximates the linear relationship between bivariate sets of data to make predictions
- 8.11(A): Construct a scatterplot and describe the observed data to address questions of association such as linear, nonlinear, and no association between bivariate data
Why You’ll Love It:
This resource combines Valentine’s Day fun with critical thinking and real-world math applications. It’s a hit with students who enjoy the thematic connection and teachers who appreciate the seamless integration of math standards. Great for individual practice, stations, or enrichment activities!
