


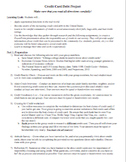
Description
This project focuses on different kinds of functions and their applications in the real world. Students will “model with mathematics” using different approaches.
In this project students will use modeling techniques to make future predictions using general statistics of a city or country and topic of their choice. Students look at different types of data; they analyze and interpret the data to decide which function best models the data. Students generate regressions of different types of functions and use them to make future predictions.
Students will choose a driving question for their project (Examples: What will the population be in ___ (choose date) in China (choose any country or city)? etc.), and will do research to find reliable data points. Then, they will create four different models (linear, quadratic, exponential, polynomial, sinusoidal, etc.) for the data, and compare and contrast them to decide on the best model. Students will use both graphing calculators and Microsoft Excel to generate their regressions.
Students will write a report and will create a presentation. They will answer their driving questions and make future predictions based on their model of best fit.
This package includes:
- Detailed instructions for the project (Procedure, Report details, Presentation details, resource link, Pacing Guide, Reflections)
- Rubrics (for both content and presentation)
- Student Self Reflection
- Audience Feedback Form
- Team Collaboration Rubric
- Technology Instructions (how to use graphing calculators and Excel to generate regressions)
Files are in .pdf formats.
Note: If you’d like to purchase 10 of my projects as a bundle and save, please go to the following link:
https://www.teacherspayteachers.com/Product/Math-in-the-Real-World-Projects-2075410
Functions Regressions Project: Using Math to Predict the Future
Highlights
Save even more with bundles
Description
This project focuses on different kinds of functions and their applications in the real world. Students will “model with mathematics” using different approaches.
In this project students will use modeling techniques to make future predictions using general statistics of a city or country and topic of their choice. Students look at different types of data; they analyze and interpret the data to decide which function best models the data. Students generate regressions of different types of functions and use them to make future predictions.
Students will choose a driving question for their project (Examples: What will the population be in ___ (choose date) in China (choose any country or city)? etc.), and will do research to find reliable data points. Then, they will create four different models (linear, quadratic, exponential, polynomial, sinusoidal, etc.) for the data, and compare and contrast them to decide on the best model. Students will use both graphing calculators and Microsoft Excel to generate their regressions.
Students will write a report and will create a presentation. They will answer their driving questions and make future predictions based on their model of best fit.
This package includes:
- Detailed instructions for the project (Procedure, Report details, Presentation details, resource link, Pacing Guide, Reflections)
- Rubrics (for both content and presentation)
- Student Self Reflection
- Audience Feedback Form
- Team Collaboration Rubric
- Technology Instructions (how to use graphing calculators and Excel to generate regressions)
Files are in .pdf formats.
Note: If you’d like to purchase 10 of my projects as a bundle and save, please go to the following link:
https://www.teacherspayteachers.com/Product/Math-in-the-Real-World-Projects-2075410
Reviews

