


What others say
Description
Line graphs are important because they help kids visualize data. By seeing data in a line graph, we can easily see trends and patterns. This can help us make better decisions about the future.
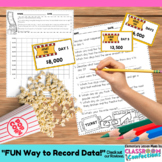
This is a movie themed line graph. This activity can be done with a partner, small group, and it is easily incorporated into you math center rotations.
What will students do in this math center?
Students will plot the ticket sales over an 8 day period. The teacher will have cut out the ticket sales' cards and have those laminated. When the students are given the set of cards, they would put them in order from day 1-8. They would then use the attached graph to plot the sales. The dollar amounts (scale) are already on the graph, but the students will add the labels for the days and then add the two main labels and title. Specific directions are given at the bottom of the graph. In addition, there are ten basic questions about the data from the graph, which could be used as a grade in conjunction with the actual graphing activity.
========================
**NOTE- you can now purchase this pack as part of my 4th grade math mega bundle.
CLICK HERE to see the mega math bundle for 4th grade. Perfect for math centers!**
========================
***** Please, if you see a typo or error, send me a message before you rate the product. I do my best to not make mistakes, but I am human and can overlook one from time to time. I can get things corrected quickly and have it ready for you to redownload. Thank you ahead of time. I really appreciate it. *****
Line Graph Math Center Activity Practice Creating a Line Graph
Highlights
What others say
Description
Line graphs are important because they help kids visualize data. By seeing data in a line graph, we can easily see trends and patterns. This can help us make better decisions about the future.
This is a movie themed line graph. This activity can be done with a partner, small group, and it is easily incorporated into you math center rotations.
What will students do in this math center?
Students will plot the ticket sales over an 8 day period. The teacher will have cut out the ticket sales' cards and have those laminated. When the students are given the set of cards, they would put them in order from day 1-8. They would then use the attached graph to plot the sales. The dollar amounts (scale) are already on the graph, but the students will add the labels for the days and then add the two main labels and title. Specific directions are given at the bottom of the graph. In addition, there are ten basic questions about the data from the graph, which could be used as a grade in conjunction with the actual graphing activity.
========================
**NOTE- you can now purchase this pack as part of my 4th grade math mega bundle.
CLICK HERE to see the mega math bundle for 4th grade. Perfect for math centers!**
========================
***** Please, if you see a typo or error, send me a message before you rate the product. I do my best to not make mistakes, but I am human and can overlook one from time to time. I can get things corrected quickly and have it ready for you to redownload. Thank you ahead of time. I really appreciate it. *****
