


Description
Line Dot Plot Digital Practice Activity
This product is a Google Slides product- students can complete it digitally. Included in this product:
-8 different line plots problems- students have to drag and drop to create dot plots
-Answer Keys
Report this resource to TPT
Reported resources will be reviewed by our team. Report this resource to let us know if this resource violates TPT's content guidelines.
Highlights
Digital downloads
Grades
6th - 7th
Subjects
Standards
CCSS5.MD.B.2
CCSS6.SP.B.4
CCSS6.SP.B.5d
Pages
2
Answer Key
Included
Save even more with bundles
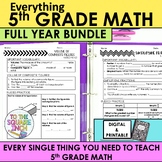
5th Grade Ultimate Bundle Unlock a world of math excellence with this comprehensive 5th Grade Math Ultimate Curriculum Bundle. This all-in-one resource is the key to ensuring your students not only grasp mathematical concepts but thrive in their 5th grade math journey.Unbelievable Savings: This is t
Price $500.00Original Price $1074.50Save $574.50
276
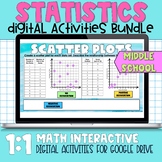
Middle School Math Statistics Digital Activities for Google Drive for Distance Learning Activities Included:1. Histograms2. Statistical Questions 3. Scatter Plots4. Stem and Leaf Plots5. Line Plots6. Measures of Central tendency 7. Box and Whisker Plot
Price $16.99Original Price $24.50Save $7.51
7
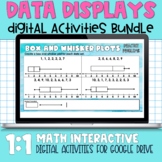
Data Displays Digital Activities for Google Drive for Distance Learning Notes included for the following topics: HistogramsLine PlotsBox and Whisker PlotsScatter PlotsLine of Best FitStem and Leaf PlotsThis product contains 5 sets of Google Slides notes- students can complete notes and practice dig
Price $25.99Original Price $38.50Save $12.51
11


Description
Line Dot Plot Digital Practice Activity
This product is a Google Slides product- students can complete it digitally. Included in this product:
-8 different line plots problems- students have to drag and drop to create dot plots
-Answer Keys
Report this resource to TPT
Reported resources will be reviewed by our team. Report this resource to let us know if this resource violates TPT's content guidelines.
Reviews
Mostly used with 6th grade
Reviews
3rd
4th
5th
6th
7th
8th
All verified TPT purchases
This was a great resource that was very easy for me to integrate and use in my classroom
This was a great resource! Engaging practice for my students!
Used in conjuction with the box plot activity, great for review and extra practice
Fantastic resource!
Great resource!
Great resource I utilized when we had extra time at the end of class and during my intervention period with students who needed additional practice with these specific skills.
Excellent resource.
great resource
Questions & Answers
Loading
Standards
to see state-specific standards (only available in the US).
CCSS5.MD.B.2
Make a line plot to display a data set of measurements in fractions of a unit (1/2, 1/4, 1/8). Use operations on fractions for this grade to solve problems involving information presented in line plots. For example, given different measurements of liquid in identical beakers, find the amount of liquid each beaker would contain if the total amount in all the beakers were redistributed equally.
CCSS6.SP.B.4
Display numerical data in plots on a number line, including dot plots, histograms, and box plots.
CCSS6.SP.B.5d
Relating the choice of measures of center and variability to the shape of the data distribution and the context in which the data were gathered.
Loading
