


Description
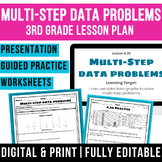
Help your 3rd grade students confidently solve multi-step data problems using bar graphs, picture graphs, and line plots with this comprehensive math lesson plan resource. Students practice interpreting data from graphs, combining information, and solving two-step comparison problems using addition and subtraction. Designed for introduction, guided practice, and review, this scaffolded lesson works seamlessly for whole-group instruction, interactive practice, sub plans, supplemental practice, review lessons, and print or digital classrooms.
Solving multi-step problems with graphs can be challenging because students must first interpret the data correctly and then determine which operations are needed. This lesson provides clear modeling and structured practice so students learn to identify what information a problem is asking for, determine the first step, and then use that result to solve the final comparison.
Teachers will love that everything is fully editable, making it easy to adapt pacing, examples, or activities to meet your classroom’s needs, whether you teach paperless, print-based, or a mix of both.
What’s Included:
This complete data problem solving lesson includes both teaching and student materials:
- Printable lesson plan with pacing, prompts, and instructional notes
- Editable Google Slides presentation for instruction (includes speaker notes aligned to the lesson plan)
- Interactive guided practice slides for students to follow along
- Printable guided practice version for print-based classrooms
- Independent practice worksheet (perfect for homework or extra in-class practice)
- Exit ticket and reflection prompts
- Answer keys for all student practice
How to Use It:
Teach this lesson during your measurement and data unit or as targeted instruction for multi-step problem solving with data. Present the lesson using the Google Slides, model strategies using the guided examples, and allow students to practice using the interactive slides or printable pages.
Because the resource is fully editable, you can:
- Choose digital, print, or hybrid formats
- Adjust examples or pacing
- Use it for whole group, small group, or reteaching
- Assign practice as classwork or homework
Standards Alignment:
CCSS.MATH.CONTENT.3.MD.B.3
Draw a scaled picture graph and a scaled bar graph to represent a data set with several categories. Solve one- and two-step "how many more" and "how many less" problems using information presented in scaled bar graphs.
This lesson focuses on solving two-step problems using bar graphs, picture graphs, and line plots.
Save planning time and give your students the structured support they need to master multi-step data problems. Download this editable, ready-to-use lesson and teach with confidence!
Teach the entire unit on Measurement & Data with a money saving bundle!
Grab it here → 3rd Grade Measurement & Data Full Math Unit | Time, Measurement, Graphing & Data
Multi-Step Data Problems | Graphs & Line Plots | 3rd Grade Math Lesson Plan
Highlights
Save even more with bundles

Description
Help your 3rd grade students confidently solve multi-step data problems using bar graphs, picture graphs, and line plots with this comprehensive math lesson plan resource. Students practice interpreting data from graphs, combining information, and solving two-step comparison problems using addition and subtraction. Designed for introduction, guided practice, and review, this scaffolded lesson works seamlessly for whole-group instruction, interactive practice, sub plans, supplemental practice, review lessons, and print or digital classrooms.
Solving multi-step problems with graphs can be challenging because students must first interpret the data correctly and then determine which operations are needed. This lesson provides clear modeling and structured practice so students learn to identify what information a problem is asking for, determine the first step, and then use that result to solve the final comparison.
Teachers will love that everything is fully editable, making it easy to adapt pacing, examples, or activities to meet your classroom’s needs, whether you teach paperless, print-based, or a mix of both.
What’s Included:
This complete data problem solving lesson includes both teaching and student materials:
- Printable lesson plan with pacing, prompts, and instructional notes
- Editable Google Slides presentation for instruction (includes speaker notes aligned to the lesson plan)
- Interactive guided practice slides for students to follow along
- Printable guided practice version for print-based classrooms
- Independent practice worksheet (perfect for homework or extra in-class practice)
- Exit ticket and reflection prompts
- Answer keys for all student practice
How to Use It:
Teach this lesson during your measurement and data unit or as targeted instruction for multi-step problem solving with data. Present the lesson using the Google Slides, model strategies using the guided examples, and allow students to practice using the interactive slides or printable pages.
Because the resource is fully editable, you can:
- Choose digital, print, or hybrid formats
- Adjust examples or pacing
- Use it for whole group, small group, or reteaching
- Assign practice as classwork or homework
Standards Alignment:
CCSS.MATH.CONTENT.3.MD.B.3
Draw a scaled picture graph and a scaled bar graph to represent a data set with several categories. Solve one- and two-step "how many more" and "how many less" problems using information presented in scaled bar graphs.
This lesson focuses on solving two-step problems using bar graphs, picture graphs, and line plots.
Save planning time and give your students the structured support they need to master multi-step data problems. Download this editable, ready-to-use lesson and teach with confidence!
Teach the entire unit on Measurement & Data with a money saving bundle!
Grab it here → 3rd Grade Measurement & Data Full Math Unit | Time, Measurement, Graphing & Data
