

Description
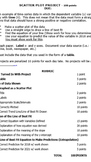
Students are asked to find an example of time-series data in which the dependent variable (y) varies linearly with time (X). The data should have a strong positive or negative correlation. Students will be asked to:
Make a scatter plot of the data.
Use a straight edge to draw a line of best fit.
Find the equation of the line where they must show work for how they determined this.
Use their equation to predict the value of the variable in 2012 and 2018.
A very detailed rubric is provided. 1 page document
Make a scatter plot of the data.
Use a straight edge to draw a line of best fit.
Find the equation of the line where they must show work for how they determined this.
Use their equation to predict the value of the variable in 2012 and 2018.
A very detailed rubric is provided. 1 page document
Report this resource to TPT
Reported resources will be reviewed by our team. Report this resource to let us know if this resource violates TPT's content guidelines.
Highlights
Description
Students are asked to find an example of time-series data in which the dependent variable (y) varies linearly with time (X). The data should have a strong positive or negative correlation. Students will be asked to:
Make a scatter plot of the data.
Use a straight edge to draw a line of best fit.
Find the equation of the line where they must show work for how they determined this.
Use their equation to predict the value of the variable in 2012 and 2018.
A very detailed rubric is provided. 1 page document
Make a scatter plot of the data.
Use a straight edge to draw a line of best fit.
Find the equation of the line where they must show work for how they determined this.
Use their equation to predict the value of the variable in 2012 and 2018.
A very detailed rubric is provided. 1 page document
Report this resource to TPT
Reported resources will be reviewed by our team. Report this resource to let us know if this resource violates TPT's content guidelines.
Reviews
All verified TPT purchases
My students loved this resource. It kept them engaged and it worked well.
I loved this activity! It really helped my students better understand the topic and was engaging.
I used this as a project for my Honors Algebra I students. I teach Alg 1 without a calculator in class and this project allowed my students to do some research on topics they found interesting and learn how to graph large pieces of data without technology.
I used this as an outline for building my own rubric for a similar project. Thank you!
Not very helpful to my planning. Could be more specific.

Do you have any suggestions on how to make it more specific? I purposely made it so that it offered student choice in which data they’d like to use.
Students enjoyed this!
Great real world application.
Great resource
Questions & Answers
Loading
Loading
