

What others say
Description
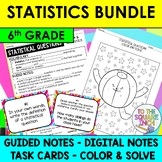
Statistics and Probability Bundle
Covers CCS: 6.SP.A.1 - 6.SP.B.5
This combination of resources will have your students proficient in all statistics and probability common core standards while keeping them engaged and actively learning. These resources are bundled together for a 25% discount, plus you'll receive the digital version of the guided notes as a bonus.
Included in this resource:
- Guided Notes & Activities
- Task Cards & Recording Sheets
- Color & Solve Activity
- BONUS: Digital Guided Notes
Topics Covered in this Bundle:
- Statistical Questions
- Shapes of Distributions
- Mean
- Median
- Range
- Mode
- Quartiles
- Interquartile Range
- Mean Absolute Deviation
- Line Plots
- Histograms
- Box & Whisker Plots
- Stem & Leaf Plots
Guided Notes - includes warm ups that build on prerequisite knowledge, in depth notes to fully teach each statistics standard, vocabulary sheets to build on key concepts, exit slips to ensure understanding and an assessment to benchmark comprehension. This note set also includes notes and practice printables formatted for interactive notebooks.
Task Cards - These cards are great for math centers, independent practice, "SCOOT" and other cooperative learning models. Includes 20 different task cards and 5 different recording sheets.
Color & Solve - perfect for independent work or homework, this color & solve activity will build on the notes and reinforce key concepts.
Digital Notes - this google slides version of the guided notes are perfect as supplementation, remote learning or make up work for absentees.
Copyright © To The Square Inch LLC
All rights reserved by the author.
Permission to copy for single classroom use only.
6th Grade Math Statistics Notes and Activity Bundle
Highlights
What others say
Save even more with bundles

Description
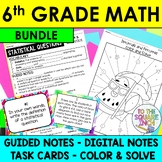
Statistics and Probability Bundle
Covers CCS: 6.SP.A.1 - 6.SP.B.5
This combination of resources will have your students proficient in all statistics and probability common core standards while keeping them engaged and actively learning. These resources are bundled together for a 25% discount, plus you'll receive the digital version of the guided notes as a bonus.
Included in this resource:
- Guided Notes & Activities
- Task Cards & Recording Sheets
- Color & Solve Activity
- BONUS: Digital Guided Notes
Topics Covered in this Bundle:
- Statistical Questions
- Shapes of Distributions
- Mean
- Median
- Range
- Mode
- Quartiles
- Interquartile Range
- Mean Absolute Deviation
- Line Plots
- Histograms
- Box & Whisker Plots
- Stem & Leaf Plots
Guided Notes - includes warm ups that build on prerequisite knowledge, in depth notes to fully teach each statistics standard, vocabulary sheets to build on key concepts, exit slips to ensure understanding and an assessment to benchmark comprehension. This note set also includes notes and practice printables formatted for interactive notebooks.
Task Cards - These cards are great for math centers, independent practice, "SCOOT" and other cooperative learning models. Includes 20 different task cards and 5 different recording sheets.
Color & Solve - perfect for independent work or homework, this color & solve activity will build on the notes and reinforce key concepts.
Digital Notes - this google slides version of the guided notes are perfect as supplementation, remote learning or make up work for absentees.
Copyright © To The Square Inch LLC
All rights reserved by the author.
Permission to copy for single classroom use only.
