


Description
Great AP Stats Notes on CORRELATION COEFFICIENT (r)! Includes step-by-step TI-84 Plus CE Calculator directions to calculate correlation coefficient from data values and estimate r using a scatterplot / scatter plot – perfect, strong, moderate, weak, positive, & negative correlation. Also learn how changes to the data values affect the correlation coefficient, make contextual deductions based on the correlation coefficient, and identify a possible confounding variable / lurking variable to validate “Correlation does not imply causation!” Templates for “interpret in context” questions are also included!
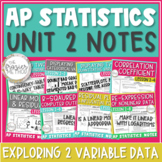
Aligns with AP College Board's updated 2019-2020 objectives and standards for AP Statistics Unit 2: Exploring Two-Variable Data.
WHAT’S INCLUDED IN THIS PRODUCT?
Lesson 2-4: Correlation Coefficient
NOTES – 2 Pages, Blank Pages & Answer Key
TYPES OF PROBLEMS:
In this set of AP Statistics notes, students will learn to:
- Define the vocabulary terms and formulas of correlation, correlation coefficient, & confounding variable / lurking variable.
- Distinguish between perfect, strong, moderate, weak, positive, & negative correlation (as well as no linear association) of two quantitative variables displayed on a scatterplot OR given the correlation coefficient r.
- Determine where the formula for correlation coefficient comes from.
- Calculate the correlation coefficient r for a set of data using a TI-84 Plus CE Calculator.
- Estimate the correlation coefficient r for a set of data displayed in a scatterplot.
- Interpret in context the correlation coefficient r with template.
- Answer questions about correlation coefficients, such as how changes to the data values affect the correlation coefficient and contextual deductions based on the correlation coefficient.
- Identify a possible confounding variable / lurking variable for a given scenario to validate “Correlation does not imply causation!”
Also included to make your Lesson-Planning easier…
- OBJECTIVES
- STANDARDS from updated 2019-2020 AP College Board Standards for AP Statistics Unit 2: Exploring Two-Variable Data.
- SUGGESTED HOMEWORK PROBLEMS from AP Statistics Textbook Stats: Modeling the World, AP Edition, 4e.
- TERMS OF USE for posting on online teaching sites like Blackboard or Moodle.
YOU MAY ALSO LIKE:
AP Statistics Unit 1 Notes Bundle
AP Statistics TI-84 Calculator Functions for the ENTIRE YEAR
AP Statistics Formulas & Vocabulary for the ENTIRE YEAR
Statistics Word Wall – Graphs, Tables, Chart, & Plots Unit 1
Statistics Word Wall – Vocabulary & Formulas Unit 1
Statistics Word Wall – Vocabulary & Graphs Unit 2
SAVE MONEY ON TPT:
Earn TPT credit by reviewing products you buy! Go to "My Purchases" and click “Provide Feedback” next to each product to leave a review. These points add up and can go towards your future purchases! YAY!!!
Thank you for considering my product for purchase!
Correlation Coefficient for Scatterplots / Scatter Plots - AP Statistics Notes
Highlights
Save even more with bundles

Description
Great AP Stats Notes on CORRELATION COEFFICIENT (r)! Includes step-by-step TI-84 Plus CE Calculator directions to calculate correlation coefficient from data values and estimate r using a scatterplot / scatter plot – perfect, strong, moderate, weak, positive, & negative correlation. Also learn how changes to the data values affect the correlation coefficient, make contextual deductions based on the correlation coefficient, and identify a possible confounding variable / lurking variable to validate “Correlation does not imply causation!” Templates for “interpret in context” questions are also included!
Aligns with AP College Board's updated 2019-2020 objectives and standards for AP Statistics Unit 2: Exploring Two-Variable Data.
WHAT’S INCLUDED IN THIS PRODUCT?
Lesson 2-4: Correlation Coefficient
NOTES – 2 Pages, Blank Pages & Answer Key
TYPES OF PROBLEMS:
In this set of AP Statistics notes, students will learn to:
- Define the vocabulary terms and formulas of correlation, correlation coefficient, & confounding variable / lurking variable.
- Distinguish between perfect, strong, moderate, weak, positive, & negative correlation (as well as no linear association) of two quantitative variables displayed on a scatterplot OR given the correlation coefficient r.
- Determine where the formula for correlation coefficient comes from.
- Calculate the correlation coefficient r for a set of data using a TI-84 Plus CE Calculator.
- Estimate the correlation coefficient r for a set of data displayed in a scatterplot.
- Interpret in context the correlation coefficient r with template.
- Answer questions about correlation coefficients, such as how changes to the data values affect the correlation coefficient and contextual deductions based on the correlation coefficient.
- Identify a possible confounding variable / lurking variable for a given scenario to validate “Correlation does not imply causation!”
Also included to make your Lesson-Planning easier…
- OBJECTIVES
- STANDARDS from updated 2019-2020 AP College Board Standards for AP Statistics Unit 2: Exploring Two-Variable Data.
- SUGGESTED HOMEWORK PROBLEMS from AP Statistics Textbook Stats: Modeling the World, AP Edition, 4e.
- TERMS OF USE for posting on online teaching sites like Blackboard or Moodle.
YOU MAY ALSO LIKE:
AP Statistics Unit 1 Notes Bundle
AP Statistics TI-84 Calculator Functions for the ENTIRE YEAR
AP Statistics Formulas & Vocabulary for the ENTIRE YEAR
Statistics Word Wall – Graphs, Tables, Chart, & Plots Unit 1
Statistics Word Wall – Vocabulary & Formulas Unit 1
Statistics Word Wall – Vocabulary & Graphs Unit 2
SAVE MONEY ON TPT:
Earn TPT credit by reviewing products you buy! Go to "My Purchases" and click “Provide Feedback” next to each product to leave a review. These points add up and can go towards your future purchases! YAY!!!
Thank you for considering my product for purchase!
