


What others say

Description
Great for online learning and distance learning!
Get your students successfully creating and using BOX PLOTS (Box-and-Whisker Plots) with this PowerPoint Presentation. This lesson begins with a focused mini-lesson and guided practice questions. It concludes with a lesson quiz and exit ticket to assess student understanding. All of the answers are included. This PowerPoint presentation is 100% editable, therefore you can modify any slide as needed.
What is Included:
_ Mini-Lesson with Guided Practice
The mini-lesson includes essential vocabulary and key terms for this topic. Students are guided through scaffolded instruction with guided practice questions for each lesson objective. All of the math problems are worked out step-by-step with detailed explanations.
_ Lesson Quiz
The lesson ends with a lesson quiz that includes questions from each topic of this lesson. This is a perfect tool to assess your students' understanding of this lesson. Have students complete these questions individually or with a partner.
_ Exit Ticket
An exit ticket question is included at the end of the presentation. Have students write the answer on a post-it or index card and turn it into you on their way out the door.
Topics Covered:
✔ Use Box Plots
✔ Find the Interquartile Range (IQR)
✔ Find the Range
Get additional STATISTICS resources to support your students' learning!
Click [HERE] to follow me and get updates on NEW and CURRENT resources.
© Exceeding the CORE. All rights reserved. Please note - this resource is for use by one teacher only. Additional teachers must purchase their own license. Copying, editing, selling, redistributing, or posting any part of this product on the internet is strictly forbidden. Violations are subject to the penalties of the Digital Millennium Copyright Act.
BOX PLOTS (Box-and-Whisker Plots) PowerPoint Lesson AND Guided Practice DIGITAL

Highlights


What others say
Save even more with bundles

Description
Great for online learning and distance learning!
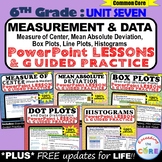
Get your students successfully creating and using BOX PLOTS (Box-and-Whisker Plots) with this PowerPoint Presentation. This lesson begins with a focused mini-lesson and guided practice questions. It concludes with a lesson quiz and exit ticket to assess student understanding. All of the answers are included. This PowerPoint presentation is 100% editable, therefore you can modify any slide as needed.
What is Included:
_ Mini-Lesson with Guided Practice
The mini-lesson includes essential vocabulary and key terms for this topic. Students are guided through scaffolded instruction with guided practice questions for each lesson objective. All of the math problems are worked out step-by-step with detailed explanations.
_ Lesson Quiz
The lesson ends with a lesson quiz that includes questions from each topic of this lesson. This is a perfect tool to assess your students' understanding of this lesson. Have students complete these questions individually or with a partner.
_ Exit Ticket
An exit ticket question is included at the end of the presentation. Have students write the answer on a post-it or index card and turn it into you on their way out the door.
Topics Covered:
✔ Use Box Plots
✔ Find the Interquartile Range (IQR)
✔ Find the Range
Get additional STATISTICS resources to support your students' learning!
Click [HERE] to follow me and get updates on NEW and CURRENT resources.
© Exceeding the CORE. All rights reserved. Please note - this resource is for use by one teacher only. Additional teachers must purchase their own license. Copying, editing, selling, redistributing, or posting any part of this product on the internet is strictly forbidden. Violations are subject to the penalties of the Digital Millennium Copyright Act.
