


Description
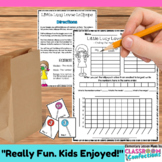
Create a bar graph, plus also find the median, mode, and range of numbers. This is a fun lollipop themed activity called, "Little Lucy Loves Lollipops". Students will pull lollipops from a baggie, and then collect the data, while also creating a bar graph with the information.
========================
**NOTE- you can now purchase this pack as part of my 4th grade math mega bundle.
CLICK HERE to see the mega math bundle for 4th grade. Perfect for math centers!**
========================
How does the bar graph/median/mode/range activity work?
The teacher will laminate the eleven lollipops. Each colored lollipop states how many lollipops Little Lucy ate over an 11 day period.
Students will pull the lollipops one by one from a bag. They will add the information to a chart showing how many she ate each day.
They are then instructed to line the lollipops up and find the median, mode, and range of the numbers. Definitions for those terms are given.
They then take the information and put it on a bar graph.
This can be a partner activity, individual, or center activity for a small group. Use it in your class however you would like.
For more creative ideas, click on 'elementary lesson plans' by my picture above.
Bar Graph Math Center : 3rd 4th 5th Grades Math Workshop
Highlights
Description
Create a bar graph, plus also find the median, mode, and range of numbers. This is a fun lollipop themed activity called, "Little Lucy Loves Lollipops". Students will pull lollipops from a baggie, and then collect the data, while also creating a bar graph with the information.
========================
**NOTE- you can now purchase this pack as part of my 4th grade math mega bundle.
CLICK HERE to see the mega math bundle for 4th grade. Perfect for math centers!**
========================
How does the bar graph/median/mode/range activity work?
The teacher will laminate the eleven lollipops. Each colored lollipop states how many lollipops Little Lucy ate over an 11 day period.
Students will pull the lollipops one by one from a bag. They will add the information to a chart showing how many she ate each day.
They are then instructed to line the lollipops up and find the median, mode, and range of the numbers. Definitions for those terms are given.
They then take the information and put it on a bar graph.
This can be a partner activity, individual, or center activity for a small group. Use it in your class however you would like.
For more creative ideas, click on 'elementary lesson plans' by my picture above.
