

Description
Like this card sort? Try my Solving Linear Equations Card Sort or get in early on my NEW GROWING BUNDLE (for the price of less than TWO sorts right now!)
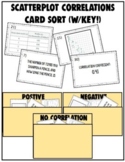
Group Activity OR Whole Class Activity!
30 total cards:
10 written scenarios
10 scatterplot graphs
7 tables
3 correlation coefficients
OPTIONAL SORTS - Weak/Strong Positive and Negatives Envelope included!
Report this resource to TPT
Reported resources will be reviewed by our team. Report this resource to let us know if this resource violates TPT's content guidelines.
Highlights
Digital downloads
Grades
8th - 9th
Subjects
Standards
CCSS8.SP.A.1
CCSSHSS-ID.B.6
Tags
Pages
8
Answer Key
Included
Teaching Duration
30 minutes
Save even more with bundles

Welcome! I have just started this bundle, but plan to add to it as a I teach 7th, 8th and Algebra throughout the year! Get it now and save BIG! Cost is currently less than my two card sorts combined! Card Sorts Included: Scatterplot CorrelationSolving Linear EquationsSorts on my To-do List: Slope -
Price $4.95Original Price $5.90Save $0.95
2
Description
Like this card sort? Try my Solving Linear Equations Card Sort or get in early on my NEW GROWING BUNDLE (for the price of less than TWO sorts right now!)
Group Activity OR Whole Class Activity!
30 total cards:
10 written scenarios
10 scatterplot graphs
7 tables
3 correlation coefficients
OPTIONAL SORTS - Weak/Strong Positive and Negatives Envelope included!
Report this resource to TPT
Reported resources will be reviewed by our team. Report this resource to let us know if this resource violates TPT's content guidelines.
Reviews
All verified TPT purchases
This was a great resource for my high school classes, thank you!
Questions & Answers
Loading
Standards
to see state-specific standards (only available in the US).
CCSS8.SP.A.1
Construct and interpret scatter plots for bivariate measurement data to investigate patterns of association between two quantities. Describe patterns such as clustering, outliers, positive or negative association, linear association, and nonlinear association.
CCSSHSS-ID.B.6
Represent data on two quantitative variables on a scatter plot, and describe how the variables are related.
Loading
