


What others say
Description
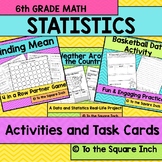
Weather Around the Country Data and Statistics Real-Life Project
CCSS: 6.SP.A.3
This project allows students to choose a city in the United States, look-up the temperature forecast, identify the location on a map and then find various measures of center and variability. Students also have the opportunity to compare their data to other cities and reflect on it. This project is a great way for students to apply their data and statistics skills to a real-life situation.
Included in this product:
4 page guided project. Students will practice looking up data, finding the mean, median, mode, and range of the data set. They will also be asked to identify all 3 quartiles, the IQR and the mean absolute deviation. They will create line plot and identify peaks, gaps, outliers and clusters. They will also compare their data to a different city and reflect on the similarities and differences.
City Idea List
Implementation Ideas
Pictures of completed example
Check out my other data and statistics products HERE
Highlights
What others say
Save even more with bundles
Description
Weather Around the Country Data and Statistics Real-Life Project
CCSS: 6.SP.A.3
This project allows students to choose a city in the United States, look-up the temperature forecast, identify the location on a map and then find various measures of center and variability. Students also have the opportunity to compare their data to other cities and reflect on it. This project is a great way for students to apply their data and statistics skills to a real-life situation.
Included in this product:
4 page guided project. Students will practice looking up data, finding the mean, median, mode, and range of the data set. They will also be asked to identify all 3 quartiles, the IQR and the mean absolute deviation. They will create line plot and identify peaks, gaps, outliers and clusters. They will also compare their data to a different city and reflect on the similarities and differences.
City Idea List
Implementation Ideas
Pictures of completed example
Check out my other data and statistics products HERE
