


Description
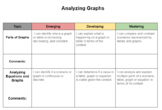
Describes data relationships in terms of correlations when provided bivariate data. Explores the relationship between correlations and causation. Beneficial for Mastery Learning and PCBL
Report this resource to TPT
Reported resources will be reviewed by our team. Report this resource to let us know if this resource violates TPT's content guidelines.
Highlights
Digital downloads
Grades
8th - 10th
Subjects
Standards
CCSS8.SP.A.1
CCSSHSS-ID.B.6
CCSSHSS-ID.B.6a
Tags
Save even more with bundles
All of 9th grade standards as rubrics ready to be used for Mastery Learning or PCBL
Price $35.00Original Price $60.00Save $25.00
21
Description
Describes data relationships in terms of correlations when provided bivariate data. Explores the relationship between correlations and causation. Beneficial for Mastery Learning and PCBL
Report this resource to TPT
Reported resources will be reviewed by our team. Report this resource to let us know if this resource violates TPT's content guidelines.
Reviews
This product has not yet been rated.
Questions & Answers
Loading
Standards
to see state-specific standards (only available in the US).
CCSS8.SP.A.1
Construct and interpret scatter plots for bivariate measurement data to investigate patterns of association between two quantities. Describe patterns such as clustering, outliers, positive or negative association, linear association, and nonlinear association.
CCSSHSS-ID.B.6
Represent data on two quantitative variables on a scatter plot, and describe how the variables are related.
CCSSHSS-ID.B.6a
Fit a function to the data; use functions fitted to data to solve problems in the context of the data.
Loading
