


Description
Ignite statistical curiosity with this math task focused on data centers, graphs, and numerical distributions. Students will use data to determine the social media preferences of their survey sample by finding the centers of the data and comparing that data using dot plots and box-and-whisker graphs. With six low-prep versions of the task, your students will soon be confident and competent in using expressions & equations to find real-world solutions.
The following downloads are included with this product:
- Instructions for teachers
- Lookup vs Hotsec Statistics Math Performance Task (6 versions)
- Lookup vs Hotsec Statistics Statistics Answer Key (6 versions)
The Lookup vs Hotsec Statistics Math Performance Task will equip students for real-life math applications while also preparing them for standardized testing. This task has a multitude of utilizations. There are six versions of the task, each version has the same context but different numbers. These tasks are perfect for collaborative class activities, individual proficiency practice, homework assignments, quizzes, or end-of-unit assessments.
Students become successful as they become more familiar with math applications! Give your students version A-D and let them work collaboratively. Once they have mastered the concepts, give version E as a quiz to prepare them for the end-of-unit assessment. Use version F as a spiral review before standardized testing. There is no better feeling than looking at a test and knowing that you know it!
This task gives students an opportunity to organize raw data, calculate data centers, analyze data distribution using both dot plots and/or box-and-whisker plots. Students will then relate data patterns to real-world context. Easily differentiable by using only page one for those who are not ready to calculate the five-number summary and IQR. Students will exhibit competence with math content standards 6.SP.A.1, 6.SP.A.2, 6.SP.A.3, 6.SP.B.4, 6.SP.B.5, 6.NS.B.2, 6.NS.C.5, 6.NS.C.6, and mathematical practices standards MP1, MP2, MP3, MP4, MP5, and MP6.
Bundle & Save for a discount
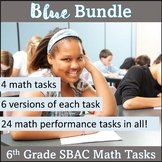
When you purchase the 6th Grade Math Performance Task Blue Bundle you will get the Lookup vs Hotsec Statistics task along with three additional 6th Grade Math Performance Tasks.
You may like these products as well….
Mini Shots Math Performance Task
Pet Rock Statistics Activity & Task
**************************************************************************************************
Customer Tips: How to get TPT credit for future purchases
Go to your “My Purchases” page. Next to each purchase, you'll see a “Provide Feedback” button. Simply click it and you will be taken to a page where you can give a quick rating and leave a short comment for the product. Each time you give feedback, TPT gives you feedback credits that you may use to lower the cost of your future purchases. I'd really love it if you'd rate the resource after downloading! Feedback is so VERY important!
**************************************************************************************************
Follow my Store
Click on the green star next to my store logo to receive upcoming sales, freebie and product launches, and email updates!
Here's to a successful year!
Absolute Value
Wendy Petty
Petty415@gmail.com
For more Project Based Learning with Mathematics available at my store: https://www.teacherspayteachers.com/Store/Absolute-Value. This project was created and provided by Absolute Value.
Data Statistics & Graphs 6th Grade SBAC Math Performance Task – Lookup vs HS
Highlights
Save even more with bundles


Description
Ignite statistical curiosity with this math task focused on data centers, graphs, and numerical distributions. Students will use data to determine the social media preferences of their survey sample by finding the centers of the data and comparing that data using dot plots and box-and-whisker graphs. With six low-prep versions of the task, your students will soon be confident and competent in using expressions & equations to find real-world solutions.
The following downloads are included with this product:
- Instructions for teachers
- Lookup vs Hotsec Statistics Math Performance Task (6 versions)
- Lookup vs Hotsec Statistics Statistics Answer Key (6 versions)
The Lookup vs Hotsec Statistics Math Performance Task will equip students for real-life math applications while also preparing them for standardized testing. This task has a multitude of utilizations. There are six versions of the task, each version has the same context but different numbers. These tasks are perfect for collaborative class activities, individual proficiency practice, homework assignments, quizzes, or end-of-unit assessments.
Students become successful as they become more familiar with math applications! Give your students version A-D and let them work collaboratively. Once they have mastered the concepts, give version E as a quiz to prepare them for the end-of-unit assessment. Use version F as a spiral review before standardized testing. There is no better feeling than looking at a test and knowing that you know it!
This task gives students an opportunity to organize raw data, calculate data centers, analyze data distribution using both dot plots and/or box-and-whisker plots. Students will then relate data patterns to real-world context. Easily differentiable by using only page one for those who are not ready to calculate the five-number summary and IQR. Students will exhibit competence with math content standards 6.SP.A.1, 6.SP.A.2, 6.SP.A.3, 6.SP.B.4, 6.SP.B.5, 6.NS.B.2, 6.NS.C.5, 6.NS.C.6, and mathematical practices standards MP1, MP2, MP3, MP4, MP5, and MP6.
Bundle & Save for a discount
When you purchase the 6th Grade Math Performance Task Blue Bundle you will get the Lookup vs Hotsec Statistics task along with three additional 6th Grade Math Performance Tasks.
You may like these products as well….
Mini Shots Math Performance Task
Pet Rock Statistics Activity & Task
**************************************************************************************************
Customer Tips: How to get TPT credit for future purchases
Go to your “My Purchases” page. Next to each purchase, you'll see a “Provide Feedback” button. Simply click it and you will be taken to a page where you can give a quick rating and leave a short comment for the product. Each time you give feedback, TPT gives you feedback credits that you may use to lower the cost of your future purchases. I'd really love it if you'd rate the resource after downloading! Feedback is so VERY important!
**************************************************************************************************
Follow my Store
Click on the green star next to my store logo to receive upcoming sales, freebie and product launches, and email updates!
Here's to a successful year!
Absolute Value
Wendy Petty
Petty415@gmail.com
For more Project Based Learning with Mathematics available at my store: https://www.teacherspayteachers.com/Store/Absolute-Value. This project was created and provided by Absolute Value.
