

Description
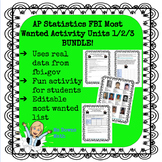
I have created a series of activities for several units in the AP Statistics curriculum. The students love using data from fbi.gov to review concepts. This activity involves analyzing data related to the top 10 most wanted fugitives. I created this activity in May of 2020 and used the top 10 at that time. In the folder, you will find an editable slide of the top 10 if you want to change it.
The answer key for the unit is based on the original top 10 that I used. Teachers have the option of having students gather additional data on fugitives. I highly recommend this as the students have a lot of fun with it!
The topics in this activity are from Unit 1, 2 and 3 of The Practice of Statistics AP edition - analyze qualitative and quantitative data, cumulative relative frequency graphs, linear transformations, z scores, assessing normality, and normal distributions, and linear regression
In the folder you will find the pdf activities and the editable top 10 most wanted Google slide.
*** BONUS FILE*** AP Stat first week of school activity!
As always, an feedback is appreciated. Thank you!
*** updated 10/2023 with the current top 10 most wanted
FBI Most Wanted AP Stat - Analyze Data, Normal Distributions, Linear Regression

Highlights


Bonus
Save even more with bundles
Description
I have created a series of activities for several units in the AP Statistics curriculum. The students love using data from fbi.gov to review concepts. This activity involves analyzing data related to the top 10 most wanted fugitives. I created this activity in May of 2020 and used the top 10 at that time. In the folder, you will find an editable slide of the top 10 if you want to change it.
The answer key for the unit is based on the original top 10 that I used. Teachers have the option of having students gather additional data on fugitives. I highly recommend this as the students have a lot of fun with it!
The topics in this activity are from Unit 1, 2 and 3 of The Practice of Statistics AP edition - analyze qualitative and quantitative data, cumulative relative frequency graphs, linear transformations, z scores, assessing normality, and normal distributions, and linear regression
In the folder you will find the pdf activities and the editable top 10 most wanted Google slide.
*** BONUS FILE*** AP Stat first week of school activity!
As always, an feedback is appreciated. Thank you!
*** updated 10/2023 with the current top 10 most wanted
