


Description
This is a math resource in Google Drive appropriate for kindergarten. It can be completed fully online!
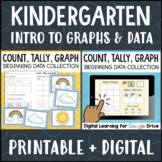
On each page/slide, students will sort moveable objects and use them to build a simple bar graph. After creating their graph, students then count how many there are of each object and add tally marks to the tally chart. Finally, they type the numeral for each set of objects to show how many.
Includes 5 separate graphing activities. I suggest using one as practice with teacher assistance before assigning the others for independent work. You can also save one to use as an assessment.
Skills covered:
- Sorting objects into like sets
- Counting sets of like objects up to 5 to answer "How many?"
- Representing quantity with tally marks
- Representing quantity with numbers
- Creating basic bar graphs
This is a great activity for independent practice during centers or for learning at home!
Answer keys are included.
__________________________________________________________________________________
Upon purchase, TpT will automatically make a copy of the Google Drive folder that contains this resource and transfer it to your own Google Drive account. In order to do this seamlessly, without any work on your part, TpT will need your permission to access your Google Drive. For more information on this, please see this page: Why does TpT need access to my Google Drive?
When assigning this activity to your students, make sure you are logged into the Google account in which it was installed.
Instructions are included for uploading this resource to Google Classroom, OneDrive, Canvas, Nearpod, Seesaw, Notability, Schoolology, Edmodo, Blackboard, Pic Collage, Padlet, and EverNote. NOTE: Not all of these platforms support the use of moveable pieces. Please make sure you know how to adapt a Google resource for your particular platform before purchasing.
__________________________________________________________________________________
This resource is also available in a PDF print version that is great for hands-on learning and math centers: Count Tally Graph - Data and Graphing for Beginners
Highlights
Save even more with bundles

Description
This is a math resource in Google Drive appropriate for kindergarten. It can be completed fully online!
On each page/slide, students will sort moveable objects and use them to build a simple bar graph. After creating their graph, students then count how many there are of each object and add tally marks to the tally chart. Finally, they type the numeral for each set of objects to show how many.
Includes 5 separate graphing activities. I suggest using one as practice with teacher assistance before assigning the others for independent work. You can also save one to use as an assessment.
Skills covered:
- Sorting objects into like sets
- Counting sets of like objects up to 5 to answer "How many?"
- Representing quantity with tally marks
- Representing quantity with numbers
- Creating basic bar graphs
This is a great activity for independent practice during centers or for learning at home!
Answer keys are included.
__________________________________________________________________________________
Upon purchase, TpT will automatically make a copy of the Google Drive folder that contains this resource and transfer it to your own Google Drive account. In order to do this seamlessly, without any work on your part, TpT will need your permission to access your Google Drive. For more information on this, please see this page: Why does TpT need access to my Google Drive?
When assigning this activity to your students, make sure you are logged into the Google account in which it was installed.
Instructions are included for uploading this resource to Google Classroom, OneDrive, Canvas, Nearpod, Seesaw, Notability, Schoolology, Edmodo, Blackboard, Pic Collage, Padlet, and EverNote. NOTE: Not all of these platforms support the use of moveable pieces. Please make sure you know how to adapt a Google resource for your particular platform before purchasing.
__________________________________________________________________________________
This resource is also available in a PDF print version that is great for hands-on learning and math centers: Count Tally Graph - Data and Graphing for Beginners
