


Description
Digital Line Plot Graphing Activity for Google - Data and Graphs
General Information:
This interactive graphing activity is created and intended for use in Google Classroom. This activity uses a series of sports and exercise related examples as an extension to the Data and Statistics Exercise Unit. After learning how to read and create a line plot, this activity can be used as a check for understanding, additional practice and as a lesson extension.
In this activity, students are first introduced to how to manipulate the shapes and items they will be using on the slides to follow. In doing so, students have less issues when completing the math related activities. Next, students work on making the graph. Following this activity slide, students extend their general understanding through the creation of a graph consisting of his/her own data. Finally, students solidify their understanding about the graph through a short writing prompt/open ended question/word problem.
This activity is recommended for students to complete independently or in pairs. When working in pairs, students may hold rich discussions about the graphs that would not take place while working independently.
The student slides can be used as a standalone activity or as a series of review questions when combined with the “Box Plot” and “Line Plot” graphing activities.
Included in this resource:
- One activity where students create a line plot
- Two activities where students create line plots based on descriptions of the
shape of the graphs
- One open ended question/writing prompt
- Teacher Instructions
- Answer Key/Sample Solutions
Topics covered/practiced in this lesson:
- Creating line plots
- Reading and interpreting line plots
- Calculating mean, median and mode from a line plot
- Gaps
- Peaks
- Clusters
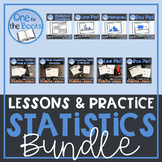
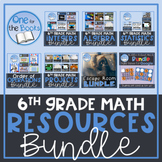
If you like this resource, check out more data resources!
Data and Statistics Activities for Google (Bundle)
Data and Statistics Exercise Unit - Bundle
Mean, Median, Mode, Outlier (*Freebie*)
Statistical Questions Card Sort Activity
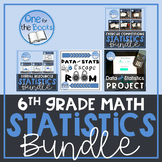
Need more ideas for a Data and Statistics Unit? Give this fun student project a try!
Data and Statistics Create a Game Project
Finished with the unit? Test student knowledge with this comprehensive Data and Statistics Escape Room Challenge!
Highlights
Save even more with bundles

Description
Digital Line Plot Graphing Activity for Google - Data and Graphs
General Information:
This interactive graphing activity is created and intended for use in Google Classroom. This activity uses a series of sports and exercise related examples as an extension to the Data and Statistics Exercise Unit. After learning how to read and create a line plot, this activity can be used as a check for understanding, additional practice and as a lesson extension.
In this activity, students are first introduced to how to manipulate the shapes and items they will be using on the slides to follow. In doing so, students have less issues when completing the math related activities. Next, students work on making the graph. Following this activity slide, students extend their general understanding through the creation of a graph consisting of his/her own data. Finally, students solidify their understanding about the graph through a short writing prompt/open ended question/word problem.
This activity is recommended for students to complete independently or in pairs. When working in pairs, students may hold rich discussions about the graphs that would not take place while working independently.
The student slides can be used as a standalone activity or as a series of review questions when combined with the “Box Plot” and “Line Plot” graphing activities.
Included in this resource:
- One activity where students create a line plot
- Two activities where students create line plots based on descriptions of the
shape of the graphs
- One open ended question/writing prompt
- Teacher Instructions
- Answer Key/Sample Solutions
Topics covered/practiced in this lesson:
- Creating line plots
- Reading and interpreting line plots
- Calculating mean, median and mode from a line plot
- Gaps
- Peaks
- Clusters
If you like this resource, check out more data resources!
Data and Statistics Activities for Google (Bundle)
Data and Statistics Exercise Unit - Bundle
Mean, Median, Mode, Outlier (*Freebie*)
Statistical Questions Card Sort Activity
Need more ideas for a Data and Statistics Unit? Give this fun student project a try!
Data and Statistics Create a Game Project
Finished with the unit? Test student knowledge with this comprehensive Data and Statistics Escape Room Challenge!
