


Description
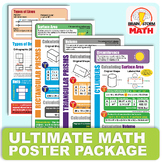
Transform your classroom with this comprehensive set of four vibrant posters designed to make teaching integers a breeze! Available in two sizes—11"x 17" for easy printing or a larger 24"x 44" for your bulletin board—they're perfect for a standard 4' x 8' display.
These posters cover everything your students need to master linear relationships, including:
- Recognizing Patterns in Tables: Students learn to identify and extend patterns by analyzing the relationship between input and output values in a table, which helps in understanding linear and non-linear relationships.
- Using Tables to Formulate Equations: Students can derive the algebraic equation representing the relationship by observing how values change in a table.
- Solving Equations from Tables: Once the equation is formulated, students can use it to solve for unknown values, predict future values, or find specific points that satisfy the equation within the table.
- Steps to Graph: using Google Sheets.
Plus, the posters can be scaled to fit any space in your classroom!
To make printing hassle-free, I've included instructions for three common scenarios. This allows you to focus on teaching, not troubleshooting.
Bring your math wall to life and help your students succeed with these essential resources!
Highlights
Save even more with bundles
Description
Transform your classroom with this comprehensive set of four vibrant posters designed to make teaching integers a breeze! Available in two sizes—11"x 17" for easy printing or a larger 24"x 44" for your bulletin board—they're perfect for a standard 4' x 8' display.
These posters cover everything your students need to master linear relationships, including:
- Recognizing Patterns in Tables: Students learn to identify and extend patterns by analyzing the relationship between input and output values in a table, which helps in understanding linear and non-linear relationships.
- Using Tables to Formulate Equations: Students can derive the algebraic equation representing the relationship by observing how values change in a table.
- Solving Equations from Tables: Once the equation is formulated, students can use it to solve for unknown values, predict future values, or find specific points that satisfy the equation within the table.
- Steps to Graph: using Google Sheets.
Plus, the posters can be scaled to fit any space in your classroom!
To make printing hassle-free, I've included instructions for three common scenarios. This allows you to focus on teaching, not troubleshooting.
Bring your math wall to life and help your students succeed with these essential resources!
