TPT
Total:
$0.00
Modeling the Business Cycle with Trig Functions: Activity and Data Set
Share

Description

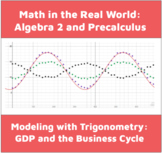
In this lab, students analyze GDP data from five fictional countries. To complete the activity, students:

-- create scatterplots of their data using desmos.com/calculator (or other graphing utility)

-- use their data sets to compute the parameters of underlying sinusoidal functions and use Desmos to compare their estimates to the data sets

-- interpret the parameters of their equations in context by describing how the economies of each country compare and contrast to each other.

-- are challenged to incorporate an increasing midline to model long term economic growth

-- use their graphs and equations to make investment recommendations based on the investment's time horizon

-- In the extension questions, students are introduced to the concept of spectral decomposition and learn how economists use it to model GDP data as the sum of simultaneous business cycles of different periods and amplitudes.

Report this resource to TPT
Reported resources will be reviewed by our team. Report this resource to let us know if this resource violates TPT's content guidelines.

Modeling the Business Cycle with Trig Functions: Activity and Data Set

Rated 5 out of 5, based on 1 reviews
5.0Β (1 rating)
$3.00
$4.00
SAVE
$1.00

Highlights

Grades icon
Grades
9th - 12th
Standards icon
Standards
Pages
8
Answer Key
Not Included
Teaching Duration
50 minutes

Description

In this lab, students analyze GDP data from five fictional countries. To complete the activity, students:

-- create scatterplots of their data using desmos.com/calculator (or other graphing utility)

-- use their data sets to compute the parameters of underlying sinusoidal functions and use Desmos to compare their estimates to the data sets

-- interpret the parameters of their equations in context by describing how the economies of each country compare and contrast to each other.

-- are challenged to incorporate an increasing midline to model long term economic growth

-- use their graphs and equations to make investment recommendations based on the investment's time horizon

-- In the extension questions, students are introduced to the concept of spectral decomposition and learn how economists use it to model GDP data as the sum of simultaneous business cycles of different periods and amplitudes.

Report this resource to TPT
Reported resources will be reviewed by our team. Report this resource to let us know if this resource violates TPT's content guidelines.

Reviews

5.0
Rated 5 out of 5, based on 1 reviews
1
rating
All verified TPT purchases
Rated 5 out of 5
March 5, 2024
I just wanted to reach out and say a huge thank you for creating such an amazing resource! The content is spot on with our curriculum, and I'm really looking forward to diving deeper into your work on the platform. I feel confident that your resource will be a huge help in making the subject matter more engaging and understandable for my students. Thanks again!
Vanessa B.
162 reviews
Grades taught: 10th

Questions & Answers

Loading

Standards

to see state-specific standards (only available in the US).
For a function that models a relationship between two quantities, interpret key features of graphs and tables in terms of the quantities, and sketch graphs showing key features given a verbal description of the relationship.
Relate the domain of a function to its graph and, where applicable, to the quantitative relationship it describes. For example, if the function 𝘩(𝘯) gives the number of person-hours it takes to assemble 𝘯 engines in a factory, then the positive integers would be an appropriate domain for the function.
Graph functions expressed symbolically and show key features of the graph, by hand in simple cases and using technology for more complicated cases.
Loading