TPT
Total:
$0.00
Scatter Plots and Linear Models Digital Notes
Share

Description

These scatter plots notes include both DIGITAL and PAPER notes. You will get links to Google Slides for digital and PDF for paper notes. These notes are designed to be used throughout a multi-day unit on scatter plot graphs and linear modeling.

Included in resource:

•“I Can” statements (2)

•Background building activity

•Notes Pages (2 Foldable notes)

•Practice problems (2 pages)

•Anchor Chart (Cheat Sheet)

•Answer Key

•Teacher’s Guide

These notes are perfect for math interactive notebooks. They take you from building background, to introducing the topic, to practicing, and finally students will have a great source to refer to throughout the year.

Report this resource to TPT
Reported resources will be reviewed by our team. Report this resource to let us know if this resource violates TPT's content guidelines.

Scatter Plots and Linear Models Digital Notes

Idea Galaxy
7.3k Followers
$3.00

Highlights

Digital downloads
Grades icon
Grades
8th - 9th
Standards icon
Standards
Pages
30
Answer Key
Included
Teaching Duration
1 Week

Save even more with bundles

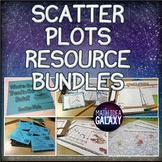
This is a collection of games, activities, and notes that will engage your students in learning about scatter plots. This is the perfect addition to your class and will give students more practice with scatterplots and can be used for differentiation, centers and stations, homework and bellringers.
Price $13.60Original Price $17.00Save $3.40
6
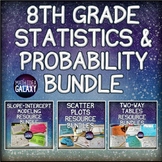
This is a collection of 21 activities to help your students learn about and practice two-way tables, scatter plots, and slope intecept modeling that are part of the 8th grade math statistics and probability cluster in the CCSS. These are great for math centers and so much more fun than worksheets.
Price $42.00Original Price $52.50Save $10.50
21
This is a collection of more than 175 activities that will engage your students in learning pre-algebra and geometry concepts in 8th grade math. These activities can be used through out year for months of lessons and practice. You will find interactie notebook foldable notes, mazes, whole class k
Price $250.00Original Price $398.75Save $148.75
150

Description

These scatter plots notes include both DIGITAL and PAPER notes. You will get links to Google Slides for digital and PDF for paper notes. These notes are designed to be used throughout a multi-day unit on scatter plot graphs and linear modeling.

Included in resource:

•“I Can” statements (2)

•Background building activity

•Notes Pages (2 Foldable notes)

•Practice problems (2 pages)

•Anchor Chart (Cheat Sheet)

•Answer Key

•Teacher’s Guide

These notes are perfect for math interactive notebooks. They take you from building background, to introducing the topic, to practicing, and finally students will have a great source to refer to throughout the year.

Report this resource to TPT
Reported resources will be reviewed by our team. Report this resource to let us know if this resource violates TPT's content guidelines.

Reviews

4.9
Rated 4.89 out of 5, based on 18 reviews
18
ratings
5
16
4
2
3
0
2
0
1
0
All verified TPT purchases
Rated 5 out of 5
October 20, 2023
A very detailed and easy to follow resource, it allows my students to see the information they are learning presented in a different manner. Easily uploaded to Google Classroom.
Charlotte C.
47 reviews
Grades taught: 8th
Rated 5 out of 5
June 21, 2023
This was great for my 8th graders. I loved the labeling examples.
Olivia H.
106 reviews
Grades taught: 8th
Rated 4 out of 5
March 2, 2022
Great notes
Tiffany P.
620 reviews
Rated 5 out of 5
June 29, 2021
I love these interactive notebooks. Great way for students to see and read key info. They are organized nicely and cover the content nicely.
Dina L.
85 reviews
Grades taught: 8th
Rated 5 out of 5
March 7, 2021
great resource
Jordyn R.
345 reviews
Grades taught: 8th
Student populations: Learning difficulties
Rated 4 out of 5
December 1, 2020
Great resource to help review before test
jenna P.
302 reviews
Grades taught: 9th
Rated 5 out of 5
November 23, 2020
Great resource very challenging and engaging for my students.
Leslie M.
847 reviews
Grades taught: 8th
Rated 5 out of 5
October 11, 2020
Good Resource.
Jessica M.
276 reviews
Grades taught: 8th
Student populations: Autism, Learning difficulties, Mild to severe disabilities

Questions & Answers

Loading

Standards

to see state-specific standards (only available in the US).
Construct and interpret scatter plots for bivariate measurement data to investigate patterns of association between two quantities. Describe patterns such as clustering, outliers, positive or negative association, linear association, and nonlinear association.
Know that straight lines are widely used to model relationships between two quantitative variables. For scatter plots that suggest a linear association, informally fit a straight line, and informally assess the model fit by judging the closeness of the data points to the line.
Use the equation of a linear model to solve problems in the context of bivariate measurement data, interpreting the slope and intercept. For example, in a linear model for a biology experiment, interpret a slope of 1.5 cm/hr as meaning that an additional hour of sunlight each day is associated with an additional 1.5 cm in mature plant height.
Loading