


Description
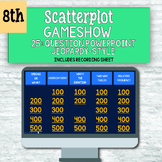
Includes: Microsoft PowerPoint Review Game, Answer Recording Sheet, How to Use Document
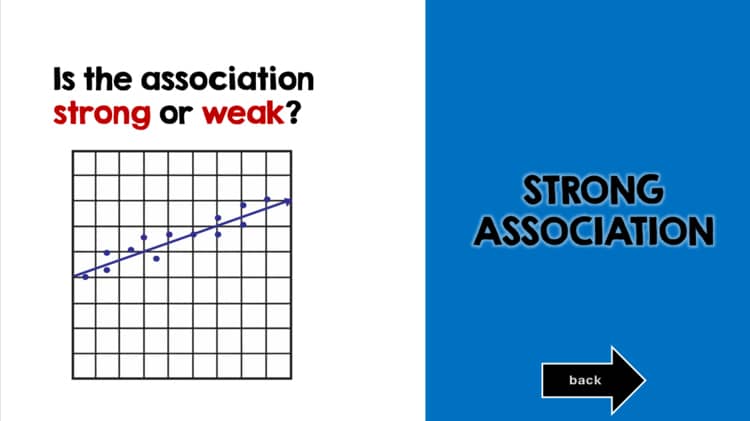
This resource is best used as a review for an 8th grade scatterplot unit. The gameshow contains 25 questions. Since the PowerPoint is editable, you can also change questions to your liking. A recording sheet for answers is included, but paper and pencil is likely not necessary for solving most of these problems.
Note: This file was made for use with Microsoft PowerPoint. While it will work on Google Slides, not all of the fonts and formatting will follow with it. Use at your own caution.
Scatterplot Review Game, Scatterplot Jeopardy, Scatterplot Game Show
Highlights
Description
Includes: Microsoft PowerPoint Review Game, Answer Recording Sheet, How to Use Document
This resource is best used as a review for an 8th grade scatterplot unit. The gameshow contains 25 questions. Since the PowerPoint is editable, you can also change questions to your liking. A recording sheet for answers is included, but paper and pencil is likely not necessary for solving most of these problems.
Note: This file was made for use with Microsoft PowerPoint. While it will work on Google Slides, not all of the fonts and formatting will follow with it. Use at your own caution.
