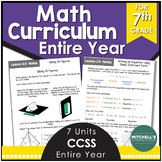
TPT
Total:
$0.00
7th Grade Probability and Statistics Math Unit
Share

Description

In this 7th grade math NO PREP product you get an entire unit on statistics and probability. This common core aligned product will engage your seventh grade students. All you have to do is print these for your students and start teaching. This unit is exactly what you need to teach the CCSS in your classroom. Each lesson focuses on specific standards with notes to introduce the topic, practice pages to reinforce what was taught, and answer keys to make discussions and grading easy.

An overview of the unit and a sample day-by-day lesson plans are included as well. Obviously this can be adjusted based on how much time you have to teach each day.

ALL chapters include:

  • Notes
  • Practice Pages
  • Answer Keys

Chapter 1 – Probability

  • Simple Probability
  • Theoretical vs. Experimental Probability
  • Compound Probability

Chapter 2 – Measures of Center

  • Mean, Median, Mode, and Range
  • Quartiles and Inner Quartile Range
  • Mean Absolute Deviation (MAD)

Chapter 3 – Displaying Data

  • Histograms
  • Box-and-Whisker Plots
  • Stem-and-Leaf Plots

There is also an assessment (quiz) over each chapter and a test over the entire Unit! There is a review for each of the quizzes as well.

*This is the same product as 7th Grade Statistics and Probability Unit 7 Using Google except this is the pdf version!

Report this resource to TPT
Reported resources will be reviewed by our team. Report this resource to let us know if this resource violates TPT's content guidelines.

7th Grade Probability and Statistics Math Unit

Rated 5 out of 5, based on 3 reviews
5.0 (3 ratings)
Mitchell's Mathematicians
1.8k Followers
$19.00

Highlights

Digital downloads
Grades icon
Grades
6th - 8th
Subjects icon
Subjects
Standards icon
Standards
Pages
127
Answer Key
Included

Save even more with bundles

Looking for a NO PREP 7th grade math curriculum that is engaging and rigorous? This common core aligned product is perfect for your seventh grade students. This bundle includes: The number system, integers and rational numbers, percents, ratios, proportions, similar figures, expressions, equations,
Price $136.00Original Price $162.50Save $26.50
7

Description

In this 7th grade math NO PREP product you get an entire unit on statistics and probability. This common core aligned product will engage your seventh grade students. All you have to do is print these for your students and start teaching. This unit is exactly what you need to teach the CCSS in your classroom. Each lesson focuses on specific standards with notes to introduce the topic, practice pages to reinforce what was taught, and answer keys to make discussions and grading easy.

An overview of the unit and a sample day-by-day lesson plans are included as well. Obviously this can be adjusted based on how much time you have to teach each day.

ALL chapters include:

  • Notes
  • Practice Pages
  • Answer Keys

Chapter 1 – Probability

  • Simple Probability
  • Theoretical vs. Experimental Probability
  • Compound Probability

Chapter 2 – Measures of Center

  • Mean, Median, Mode, and Range
  • Quartiles and Inner Quartile Range
  • Mean Absolute Deviation (MAD)

Chapter 3 – Displaying Data

  • Histograms
  • Box-and-Whisker Plots
  • Stem-and-Leaf Plots

There is also an assessment (quiz) over each chapter and a test over the entire Unit! There is a review for each of the quizzes as well.

*This is the same product as 7th Grade Statistics and Probability Unit 7 Using Google except this is the pdf version!

Report this resource to TPT
Reported resources will be reviewed by our team. Report this resource to let us know if this resource violates TPT's content guidelines.

Reviews

5.0
Rated 5 out of 5, based on 3 reviews
3
ratings
All verified TPT purchases
Rated 5 out of 5
September 24, 2020
Easy to use. Thank you
Jennifer C.
386 reviews
Grades taught: 8th
Rated 5 out of 5
June 1, 2020
This was a great start for our statistics unit
misseggebrecht
(TPT Seller)
81 reviews
Grades taught: 7th
Student populations: Autism, Learning difficulties
Rated 5 out of 5
April 1, 2020
I homeschool my 7th grader, and this unit was so easy and fun for us to do! There are notes pages (with answers) that I can use to teach each skill, then great practice sheets with pictures for her to work on the skills independently. Quiz reviews and Quizzes are included as well. Loved this unit!
Sarah Campell
(TPT Seller)
93 reviews
Grades taught: 7th
Mitchell's Mathematicians
Response from
Mitchell's Mathematicians
(TPT Seller)
Apr 2, 2020
Thank you so much for the kind words. I am glad it was so user friendly!

Questions & Answers

Loading

Standards

to see state-specific standards (only available in the US).
Understand that statistics can be used to gain information about a population by examining a sample of the population; generalizations about a population from a sample are valid only if the sample is representative of that population. Understand that random sampling tends to produce representative samples and support valid inferences.
Use data from a random sample to draw inferences about a population with an unknown characteristic of interest. Generate multiple samples (or simulated samples) of the same size to gauge the variation in estimates or predictions. For example, estimate the mean word length in a book by randomly sampling words from the book; predict the winner of a school election based on randomly sampled survey data. Gauge how far off the estimate or prediction might be.
Informally assess the degree of visual overlap of two numerical data distributions with similar variabilities, measuring the difference between the centers by expressing it as a multiple of a measure of variability. For example, the mean height of players on the basketball team is 10 cm greater than the mean height of players on the soccer team, about twice the variability (mean absolute deviation) on either team; on a dot plot, the separation between the two distributions of heights is noticeable.
Loading