


Description
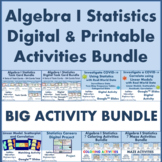
Distance Learning: 2 Quantitative Variables Digital Task Cards: Scatter plots, Models, Functions, Correlation (Common Core Aligned)
These digital task cards are adapted from the printable version of the 2 Quantitative Variables Digital Task Cards: Scatter plots, Models, Functions, Correlation available here.
This product includes 24 task cards created with Google™ Forms:
8 task cards on scatter plots to describe relationships (linear, quadratic, exponential)
4 task cards on interpreting slope and intercept of linear models
8 task cards on assessing the fit of linear models and interpreting residuals
4 task cards on interpreting the correlation coefficient and distinguishing between correlation and causation
These digital task cards are perfect for distance learning, independent work, graded assessments, or practice. This resource includes answer key with feedback, multiple editable features and is easy to share with your students via email, secure course website, or Google™ Classroom. Note that the actual task card is an uneditable image; however, you can edit the response type and options, feedback, answer key, and more. You also get a detailed answer key and as a bonus, you get the answer sheet with the Spirograph-inspired design that comes with the printable version of these task cards.
About the task card border designs:
If you teach mathematics or statistics, there is a good chance that you enjoyed playing with Spirograph as a child. Spirograph is a toy that involves tracing a circle moving around either the inside or outside of a wheel, making beautiful designs. Well, these designs can also be made on a computer with graphing software and some trigonometric functions. Added bonus: no smudged ink or accidentally moving the paper! Although they aren’t statistical per se, these Spirograph-inspired designs are a great opportunity to convey the beauty of mathematics to students.
These cards also feature clip art created by some of your favorite TpT sellers:
Books and Computers © Clipart Coach Academics at https://www.teacherspayteachers.com/Store/Clipart-Coach-Academics
Computers and monitors © Kate Hadfield Designs at https://www.teacherspayteachers.com/Store/Kate-Hadfield-Designs
Cupcakes © MyClipArtStore at https://www.teacherspayteachers.com/Store/Myclipartstore
Milk carton © Prawny at https://www.teacherspayteachers.com/Store/Prawny
Milk canister © Doodle Star Art at https://www.teacherspayteachers.com/Store/Doodle-Star-Art
Ice cream © Teaching Lane at https://www.teacherspayteachers.com/Store/Teaching-Lane
Books and other school supplies © Studio Devanna at https://www.teacherspayteachers.com/Store/Studio-Devanna
Race track © Color Idea at https://www.teacherspayteachers.com/Store/Color-Idea
Sneakers © Mae Hates Mondays at https://www.teacherspayteachers.com/Store/Mae-Hates-Mondays
Technology © Kim Maslin – Digital Technologies Educator at https://www.teacherspayteachers.com/Store/Kim-Maslin-Digital-Technologies-Educator
Hair brush © Storytime Sprout at https://www.teacherspayteachers.com/Store/Storytime-Sprout
Scissors © LovinLifeskills at https://www.teacherspayteachers.com/Store/Lovinlifeskills
Math symbols © Teacher’s Helping Hands at https://www.teacherspayteachers.com/Store/Teachers-Helping-Hands
Old school TVs © The Mouse that Roared at https://www.teacherspayteachers.com/Store/The-Mouse-That-Roared
Trees © revidevi at https://www.teacherspayteachers.com/Store/Revidevi
Cookies and milk © Empty Jar Illustrations at https://www.teacherspayteachers.com/Store/Empty-Jar-Illustrations
Couch and bed © TL Designs at https://www.teacherspayteachers.com/Store/Tl-Designs
Clothing © Vida Buena at https://www.teacherspayteachers.com/Store/Vida-Buena
Latte cups © Cloudy Daze at https://www.teacherspayteachers.com/Store/Cloudy-Daze
Smart phones © Creative to the Core at https://www.teacherspayteachers.com/Store/Creative-To-The-Core
Graduation clip art © Charlotte’s Clips at https://www.teacherspayteachers.com/Store/Charlottes-Clips-4150
Cars © Speech Doodles at https://www.teacherspayteachers.com/Store/Speech-Doodles
This product includes:
This product includes a PDF with:
1) A link to the 24 editable, self-grading digital task cards
2) Detailed instructions on how to access the digital task cards
3) A bonus three-page recording sheet
4) A three-page detailed answer key
Objectives:
1) Practice interpreting a scatterplot representing two quantitative variables.
2) Practice describing the relationship between two variables.
3) Practice fitting a function (e.g., linear, quadratic, exponential) to data.
4) Practice using a scatterplot to choose a function and using functions to solve problems.
5) Practice interpreting linear models.
6) Practice interpreting the correlation coefficient of a linear fit.
7) Practice interpreting and analyzing residual plots.
8) Practice distinguishing between correlation and causation.
Common Core Standards:
HSS.ID.B.6: Represent two quantitative variables on a scatterplot and describe how the variables are related.
HSS.ID.B.6.A: Fit a function to the data; use functions fitted to data to solve problems in the context of data. Use given functions or choose a function suggested by the context. Emphasize linear, quadratic, and exponential models.
HSS.ID.B.6.B: Informally assess the fit of a function by plotting and analyzing residuals.
HSS.ID.B.6.C: Fit a linear function for a scatterplot that suggests a linear association.
HSS.ID.C.7: Interpret the slope (rate of change) and intercept (constant term) of a linear model in the context of data.
HSS.ID.C.8: Compute (using technology) and interpret the correlation coefficient of a linear fit.
HSS.ID.C.9: Distinguish between correlation and causation.
About this product:
This purchase is to be used by one teacher only for classroom use. These materials may not be shared without purchasing the appropriate number of licenses. These materials may not be redistributed or posted to the internet in any form except for secure classroom websites for classroom use only.
The data and plots were simulated and created, respectively, using R Statistical Software, a free open-source software for statistical computing. Please let me know if you are interested in educational products on using R for the Common Core.
Want more resources on these topics? Check these out!:
Linear, Quadratic, Exponential Functions; Scatterplots (Common Core Lesson)
Lesson: Scatterplots, Linear Regression, Correlation vs. Causation (Common Core)
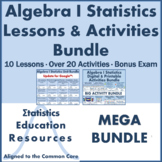
Algebra 1 Statistics Unit Curriculum Bundle (Common Core Aligned)
Additional Tips:
Want to earn TeachersPayTeachers credit for future purchases?
1) Login and visit your ‘My Purchases’ page
2) Click the ‘Provide Feedback’ button.
3) Leave a rating and quick comment.
4) Your feedback will help in creating future products for the teaching community.
Want to be first to learn more about Statistics Education Resources products?
1) Look for the green star near the top of the page by the store name, Statistics Education Resources.
2) Click it to be first to know about my new products, freebies, and discounts!
© Statistics Education Resources, 2019, 2020
Disclaimers:
The National Governors Association Center for Best Practices and Council of Chief State School Officers are the sole owners and developers of the Common Core State Standards. © Copyright 2010. National Governors Association Center for Best Practices and Council of Chief State School Officers. All rights reserved. Spirograph is the trademark of Hasbro. © Hasbro. All rights reserved.
This product is the work of Statistics Education Resources. Claims of alignment with the Common Core State Standards are the personal opinion of Statistics Education Resources and do not necessarily reflect the official views of the National Governors Association Center for Best Practices and Council of Chief State School Officers. No association with or endorsement by the National Governors Association Center for Best Practices and Council of Chief State School Officers is intended or implied. Claims of inspiration by Spirograph are the opinion of Statistics Education Resources and do not necessarily reflect the official views of Hasbro. No association with or endorsement by Hasbro is intended or implied.
Highlights
Save even more with bundles


Description
Distance Learning: 2 Quantitative Variables Digital Task Cards: Scatter plots, Models, Functions, Correlation (Common Core Aligned)
These digital task cards are adapted from the printable version of the 2 Quantitative Variables Digital Task Cards: Scatter plots, Models, Functions, Correlation available here.
This product includes 24 task cards created with Google™ Forms:
8 task cards on scatter plots to describe relationships (linear, quadratic, exponential)
4 task cards on interpreting slope and intercept of linear models
8 task cards on assessing the fit of linear models and interpreting residuals
4 task cards on interpreting the correlation coefficient and distinguishing between correlation and causation
These digital task cards are perfect for distance learning, independent work, graded assessments, or practice. This resource includes answer key with feedback, multiple editable features and is easy to share with your students via email, secure course website, or Google™ Classroom. Note that the actual task card is an uneditable image; however, you can edit the response type and options, feedback, answer key, and more. You also get a detailed answer key and as a bonus, you get the answer sheet with the Spirograph-inspired design that comes with the printable version of these task cards.
About the task card border designs:
If you teach mathematics or statistics, there is a good chance that you enjoyed playing with Spirograph as a child. Spirograph is a toy that involves tracing a circle moving around either the inside or outside of a wheel, making beautiful designs. Well, these designs can also be made on a computer with graphing software and some trigonometric functions. Added bonus: no smudged ink or accidentally moving the paper! Although they aren’t statistical per se, these Spirograph-inspired designs are a great opportunity to convey the beauty of mathematics to students.
These cards also feature clip art created by some of your favorite TpT sellers:
Books and Computers © Clipart Coach Academics at https://www.teacherspayteachers.com/Store/Clipart-Coach-Academics
Computers and monitors © Kate Hadfield Designs at https://www.teacherspayteachers.com/Store/Kate-Hadfield-Designs
Cupcakes © MyClipArtStore at https://www.teacherspayteachers.com/Store/Myclipartstore
Milk carton © Prawny at https://www.teacherspayteachers.com/Store/Prawny
Milk canister © Doodle Star Art at https://www.teacherspayteachers.com/Store/Doodle-Star-Art
Ice cream © Teaching Lane at https://www.teacherspayteachers.com/Store/Teaching-Lane
Books and other school supplies © Studio Devanna at https://www.teacherspayteachers.com/Store/Studio-Devanna
Race track © Color Idea at https://www.teacherspayteachers.com/Store/Color-Idea
Sneakers © Mae Hates Mondays at https://www.teacherspayteachers.com/Store/Mae-Hates-Mondays
Technology © Kim Maslin – Digital Technologies Educator at https://www.teacherspayteachers.com/Store/Kim-Maslin-Digital-Technologies-Educator
Hair brush © Storytime Sprout at https://www.teacherspayteachers.com/Store/Storytime-Sprout
Scissors © LovinLifeskills at https://www.teacherspayteachers.com/Store/Lovinlifeskills
Math symbols © Teacher’s Helping Hands at https://www.teacherspayteachers.com/Store/Teachers-Helping-Hands
Old school TVs © The Mouse that Roared at https://www.teacherspayteachers.com/Store/The-Mouse-That-Roared
Trees © revidevi at https://www.teacherspayteachers.com/Store/Revidevi
Cookies and milk © Empty Jar Illustrations at https://www.teacherspayteachers.com/Store/Empty-Jar-Illustrations
Couch and bed © TL Designs at https://www.teacherspayteachers.com/Store/Tl-Designs
Clothing © Vida Buena at https://www.teacherspayteachers.com/Store/Vida-Buena
Latte cups © Cloudy Daze at https://www.teacherspayteachers.com/Store/Cloudy-Daze
Smart phones © Creative to the Core at https://www.teacherspayteachers.com/Store/Creative-To-The-Core
Graduation clip art © Charlotte’s Clips at https://www.teacherspayteachers.com/Store/Charlottes-Clips-4150
Cars © Speech Doodles at https://www.teacherspayteachers.com/Store/Speech-Doodles
This product includes:
This product includes a PDF with:
1) A link to the 24 editable, self-grading digital task cards
2) Detailed instructions on how to access the digital task cards
3) A bonus three-page recording sheet
4) A three-page detailed answer key
Objectives:
1) Practice interpreting a scatterplot representing two quantitative variables.
2) Practice describing the relationship between two variables.
3) Practice fitting a function (e.g., linear, quadratic, exponential) to data.
4) Practice using a scatterplot to choose a function and using functions to solve problems.
5) Practice interpreting linear models.
6) Practice interpreting the correlation coefficient of a linear fit.
7) Practice interpreting and analyzing residual plots.
8) Practice distinguishing between correlation and causation.
Common Core Standards:
HSS.ID.B.6: Represent two quantitative variables on a scatterplot and describe how the variables are related.
HSS.ID.B.6.A: Fit a function to the data; use functions fitted to data to solve problems in the context of data. Use given functions or choose a function suggested by the context. Emphasize linear, quadratic, and exponential models.
HSS.ID.B.6.B: Informally assess the fit of a function by plotting and analyzing residuals.
HSS.ID.B.6.C: Fit a linear function for a scatterplot that suggests a linear association.
HSS.ID.C.7: Interpret the slope (rate of change) and intercept (constant term) of a linear model in the context of data.
HSS.ID.C.8: Compute (using technology) and interpret the correlation coefficient of a linear fit.
HSS.ID.C.9: Distinguish between correlation and causation.
About this product:
This purchase is to be used by one teacher only for classroom use. These materials may not be shared without purchasing the appropriate number of licenses. These materials may not be redistributed or posted to the internet in any form except for secure classroom websites for classroom use only.
The data and plots were simulated and created, respectively, using R Statistical Software, a free open-source software for statistical computing. Please let me know if you are interested in educational products on using R for the Common Core.
Want more resources on these topics? Check these out!:
Linear, Quadratic, Exponential Functions; Scatterplots (Common Core Lesson)
Lesson: Scatterplots, Linear Regression, Correlation vs. Causation (Common Core)
Algebra 1 Statistics Unit Curriculum Bundle (Common Core Aligned)
Additional Tips:
Want to earn TeachersPayTeachers credit for future purchases?
1) Login and visit your ‘My Purchases’ page
2) Click the ‘Provide Feedback’ button.
3) Leave a rating and quick comment.
4) Your feedback will help in creating future products for the teaching community.
Want to be first to learn more about Statistics Education Resources products?
1) Look for the green star near the top of the page by the store name, Statistics Education Resources.
2) Click it to be first to know about my new products, freebies, and discounts!
© Statistics Education Resources, 2019, 2020
Disclaimers:
The National Governors Association Center for Best Practices and Council of Chief State School Officers are the sole owners and developers of the Common Core State Standards. © Copyright 2010. National Governors Association Center for Best Practices and Council of Chief State School Officers. All rights reserved. Spirograph is the trademark of Hasbro. © Hasbro. All rights reserved.
This product is the work of Statistics Education Resources. Claims of alignment with the Common Core State Standards are the personal opinion of Statistics Education Resources and do not necessarily reflect the official views of the National Governors Association Center for Best Practices and Council of Chief State School Officers. No association with or endorsement by the National Governors Association Center for Best Practices and Council of Chief State School Officers is intended or implied. Claims of inspiration by Spirograph are the opinion of Statistics Education Resources and do not necessarily reflect the official views of Hasbro. No association with or endorsement by Hasbro is intended or implied.
Reviews

