


Description
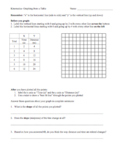
This worksheet gives students 4 distance vs time graphs and a series of questions about each to lead them through reading graphs. The main goal is to hammer home the point that slope = velocity.
This is the second in my set of worksheets on graphing that will lead students through the basics of constructing graphs, interpreting the meaning of graphs, and calculating quantities from graphs.
This is ideal for physical science classes where the students are in pre-algebra or algebra 1.
Highlights
Save even more with bundles


Description
This worksheet gives students 4 distance vs time graphs and a series of questions about each to lead them through reading graphs. The main goal is to hammer home the point that slope = velocity.
This is the second in my set of worksheets on graphing that will lead students through the basics of constructing graphs, interpreting the meaning of graphs, and calculating quantities from graphs.
This is ideal for physical science classes where the students are in pre-algebra or algebra 1.
