


Description
Here's AP Stats notes on RE-EXPRESSION OF NONLINEAR SCATTERPLOT DATA. Step-by-step instructions are provided for TI-84 Plus CE Calculators to graph a scatterplot, create a list of residuals, and graph the residual plot with re-expressed data from logarithms: an Exponential Model (x, log(y)) or Power Model (log(x), log(y)). Students will learn to determine when and how to re-express nonlinear data using logarithms, write the new regression equation, and then use the model to interpret features such as slope, correlation coefficient, and r-squared.
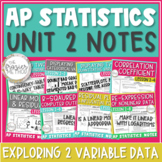
Aligns with AP College Board's updated 2019-2020 objectives and standards for AP Statistics Unit 2: Exploring Two-Variable Data.
WHAT’S INCLUDED IN THIS PRODUCT?
Lesson 2-8: Re-Expression with Nonlinear Data (Linear Regression)
NOTES – 2 Pages, Blank Pages & Answer Key
TYPES OF PROBLEMS:
In this set of AP Statistics notes, students will learn to:
• Determine when to re-express a set of data using logarithms with the Exponential Model and Power Model.
• Recognize the Ladder of Powers in reference to re-expression.
• Re-express data with step-by-step directions for TI-84 Plus CE Calculator Functions.
• Interpret the slope, correlation coefficient, and r-squared of the re-expressed data.
• Use a re-expressed regression equation to predict data values.
Also included to make your Lesson-Planning easier…
- OBJECTIVES
- STANDARDS from updated 2019-2020 AP College Board Standards for AP Statistics Unit 2: Exploring Two-Variable Data.
- SUGGESTED HOMEWORK PROBLEMS from AP Statistics Textbook Stats: Modeling the World, AP Edition, 4e.
- TERMS OF USE for posting on online teaching sites like Blackboard or Moodle.
YOU MAY ALSO LIKE:
Statistics Word Wall – Unit 2 Vocabulary & Graphs
AP Statistics 2-5 Notes – Linear Models & Residuals
AP Statistics 2-6 Notes – R-Squared & Computer Output
AP Statistics Unit 1 Notes Bundle
AP Statistics Unit 3 Notes Bundle
AP Statistics TI-84 Calculator Functions for the ENTIRE YEAR
AP Statistics Formulas & Vocabulary for the ENTIRE YEAR
Statistics Word Wall Bundle – Unit 1 Vocabulary, Graphs, & Calculator Functions
SAVE MONEY ON TPT:
Earn TPT credit by reviewing products you buy! Go to "My Purchases" and click “Provide Feedback” next to each product to leave a review. These points add up and can go towards your future purchases! YAY!!!
Thank you for considering my product for purchase!
Re-Expression of Nonlinear Scatterplot with Logarithms - AP Statistics Notes
Highlights
Save even more with bundles

Description
Here's AP Stats notes on RE-EXPRESSION OF NONLINEAR SCATTERPLOT DATA. Step-by-step instructions are provided for TI-84 Plus CE Calculators to graph a scatterplot, create a list of residuals, and graph the residual plot with re-expressed data from logarithms: an Exponential Model (x, log(y)) or Power Model (log(x), log(y)). Students will learn to determine when and how to re-express nonlinear data using logarithms, write the new regression equation, and then use the model to interpret features such as slope, correlation coefficient, and r-squared.
Aligns with AP College Board's updated 2019-2020 objectives and standards for AP Statistics Unit 2: Exploring Two-Variable Data.
WHAT’S INCLUDED IN THIS PRODUCT?
Lesson 2-8: Re-Expression with Nonlinear Data (Linear Regression)
NOTES – 2 Pages, Blank Pages & Answer Key
TYPES OF PROBLEMS:
In this set of AP Statistics notes, students will learn to:
• Determine when to re-express a set of data using logarithms with the Exponential Model and Power Model.
• Recognize the Ladder of Powers in reference to re-expression.
• Re-express data with step-by-step directions for TI-84 Plus CE Calculator Functions.
• Interpret the slope, correlation coefficient, and r-squared of the re-expressed data.
• Use a re-expressed regression equation to predict data values.
Also included to make your Lesson-Planning easier…
- OBJECTIVES
- STANDARDS from updated 2019-2020 AP College Board Standards for AP Statistics Unit 2: Exploring Two-Variable Data.
- SUGGESTED HOMEWORK PROBLEMS from AP Statistics Textbook Stats: Modeling the World, AP Edition, 4e.
- TERMS OF USE for posting on online teaching sites like Blackboard or Moodle.
YOU MAY ALSO LIKE:
Statistics Word Wall – Unit 2 Vocabulary & Graphs
AP Statistics 2-5 Notes – Linear Models & Residuals
AP Statistics 2-6 Notes – R-Squared & Computer Output
AP Statistics Unit 1 Notes Bundle
AP Statistics Unit 3 Notes Bundle
AP Statistics TI-84 Calculator Functions for the ENTIRE YEAR
AP Statistics Formulas & Vocabulary for the ENTIRE YEAR
Statistics Word Wall Bundle – Unit 1 Vocabulary, Graphs, & Calculator Functions
SAVE MONEY ON TPT:
Earn TPT credit by reviewing products you buy! Go to "My Purchases" and click “Provide Feedback” next to each product to leave a review. These points add up and can go towards your future purchases! YAY!!!
Thank you for considering my product for purchase!
