


Description
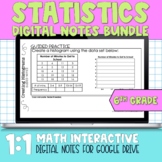
6th Grade Statistics and Statistics Math Digital Notes for Google Drive
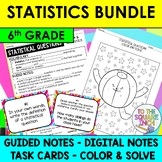
Topics Included:
- Statistical Questions
- Shapes of Distributions
- Finding Mean
- Finding Mode
- Finding Median
- Finding Range
- Quartiles
- Interquartile Range (IQR)
- Mean Absolute Deviation (MAD)
- Line Plots
- Histograms
- Box and Whisker Plots
- Stem and Leaf Plots
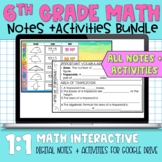
This product contains 13 sets of Google Slides notes- students can complete notes and practice digitally. Included for each topic:
-Guided Notes and guided practice
-Practice Problems
-Vocabulary Models
-2 warm-ups
-2 exit slips
-1 page with Google Tools Shortcuts for student use
-Answer Keys
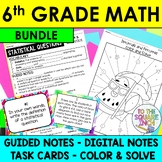
Highlights
Save even more with bundles

Description
6th Grade Statistics and Statistics Math Digital Notes for Google Drive
Topics Included:
- Statistical Questions
- Shapes of Distributions
- Finding Mean
- Finding Mode
- Finding Median
- Finding Range
- Quartiles
- Interquartile Range (IQR)
- Mean Absolute Deviation (MAD)
- Line Plots
- Histograms
- Box and Whisker Plots
- Stem and Leaf Plots
This product contains 13 sets of Google Slides notes- students can complete notes and practice digitally. Included for each topic:
-Guided Notes and guided practice
-Practice Problems
-Vocabulary Models
-2 warm-ups
-2 exit slips
-1 page with Google Tools Shortcuts for student use
-Answer Keys
